sergiodj
on 18 November 2024
Software developers spend a huge amount of effort working on optimization – extracting more speed and better performance from their algorithms and programs. This work usually involves a lot of time-consuming manual investigation, making automatic performance optimization a hot topic in the world of software development.
Profile-guided optimization (PGO) (also known as FDO, feedback-driven optimization) is a technique that leverages the power of a profiler and a compiler to automatically optimize a piece of software. The idea is that a binary is compiled with built-in instrumentation that generates a profile when executed. This profile is used as input for the compiler in a subsequent build of the same binary, and it serves as a guide for further optimizations.
This sounds great, but in reality it’s hard to do profiling of real world applications. Ideally, the profile should be generated by a representative workload of the program, but that’s not always possible to simulate. Moreover, the built-in instrumentation impacts the overall performance of the binary which introduces a performance penalty.
To address these problems nowadays, we use tools like perf to “observe” what the binary is doing externally (sampling it, by monitoring events using Linux kernel’s Performance Monitoring Unit – PMU), which makes the process more suitable for use in production environments. This technique works better than the regular built-in instrumentation, and it’s what we used to study how much performance gain could be achieved by using PGO in one of our most-used packages.
It’s also interesting to note that using PGO might actually negatively affect the performance of workloads that, although perfectly valid, are not related to the one that was performed to gather the initial profile data. We will try to analyze these questions in our case study.
Case study: QEMU RISC-V emulation
If you have ever used Launchpad to build packages, or if you are an enthusiast of the RISC-V architecture, you might have noticed that Ubuntu offers RISC-V builds for almost all of its packages. In fact, you can even download and install an entire Ubuntu distribution for RISC-V.
Access to RISC-V hardware is becoming increasingly ubiquitous, but back when Ubuntu started supporting the architecture it could be difficult to obtain RISC-V boards. For that reason, our Launchpad RISC-V builders were set up to run inside QEMU on top of AMD64 machines. These emulated builders are still in use today, performing hundreds of package builds every day. For that reason, when the Ubuntu Server team started investigating PGO it was decided that one of the best cases to be studied was exactly that of running an emulated RISC-V system within QEMU on top of an AMD64 machine.
Obtaining the profiling data
One of the first things that had to be decided was how to obtain the performance measurements in a way that could be fed back to GCC. As outlined above, I wanted to use perf to collect data about the execution of QEMU while it was performing package builds inside the emulated RISC-V environment. GCC, however, does not understand the data files generated by perf, so I needed something to convert them to gcov, which is what GCC expects in order to do its magic with PGO.
Ubuntu ships a software package called autofdo, that does just what I needed. It took me some time and effort to make everything work together (including building a newer version of the autofdo package in a PPA), but in the end I was able to generate a valid gcov file that GCC happily consumed.
Note: You might be interested to check our explanation page on the technical details involved in profiling a software.
Determining representative workloads
The next important step was to determine valid workloads to be profiled. Because I would be profiling QEMU running an emulated RISC-V environment where Ubuntu packages are built, I decided to look for packages that:
- Took a reasonable amount of time to build. Ideally, I wanted packages that took more than 1 hour but less than 6 hours to build on Launchpad’s RISC-V builders.
- Were implemented using different languages and frameworks between themselves. I wanted to evaluate the performance impact of using a QEMU that had been optimized for one specific workload while building another completely different workload.
After some research, I ended up using the following four packages:
- OpenSSL, which is implemented in C. QEMU will be profiled only when building OpenSSL, and a new QEMU will be built using profiling data from this build.
- GDB, which is implemented in C++.
- Emacs, whose core is implemented in C but has a lot of Elisp code around.
- Python3.12, whose core is implemented in C but has a lot of Python code around.
The idea, as explained above, is to measure the performance of QEMU while building all four packages without PGO. Then, using the profiling data obtained from the OpenSSL build, building a new QEMU and taking new performance measurements.
In order to get a more statistically significant dataset, I measured and calculated averages of 5 builds for each package.
Hardware & software setup
Performance metrics can be influenced by the hardware used. This is what I used for this investigation:
- AMD Ryzen™ 9 7950X3D (16 cores)
- 128 GB DDR5 ECC
- 1.92 TB (Gen 4) SSD
QEMU was invoked with the following parameters:
-machine virt \
-m 8192 \
-smp 8 \
-display none \
-bios /usr/lib/riscv64-linux-gnu/opensbi/generic/fw_jump.bin \
-kernel /usr/lib/u-boot/qemu-riscv64_smode/uboot.elf \
-device virtio-net-pci,netdev=net0 \
-netdev user,id=net0,hostfwd=tcp:127.0.0.1:6222-:22 \
-object rng-random,filename=/dev/urandom,id=rng0 \
-device virtio-rng-pci,rng=rng0,id=rng-device0 \
-daemonize
perf was invoked using:
perf record \
  -e branch_insn \
  --branch-any \
  -p ${QEMU_PID} \
  --all-cpus \
  --count 100003 \
  --quiet \
  --output output.perfdata \
  -- sleep 300
Due to constraints on the size of the generated perf data (sometimes getting a 10GB+ file!), I opted to perform “burst” profiling (i.e., profile QEMU for 5 minutes, every 10 minutes).
Results
The results obtained were interesting, to say the least. Let’s analyze them, taking into account the package that was built.
In the graphs below, we will see the comparison of the average CPU utilization (in minutes; the bars on the left side) as well as the comparison of the average build times (in minutes; the bars on the right side) between non-PGO and PGO builds of each package. The graphs also display error bars representing the standard deviation for each measurement.
OpenSSL
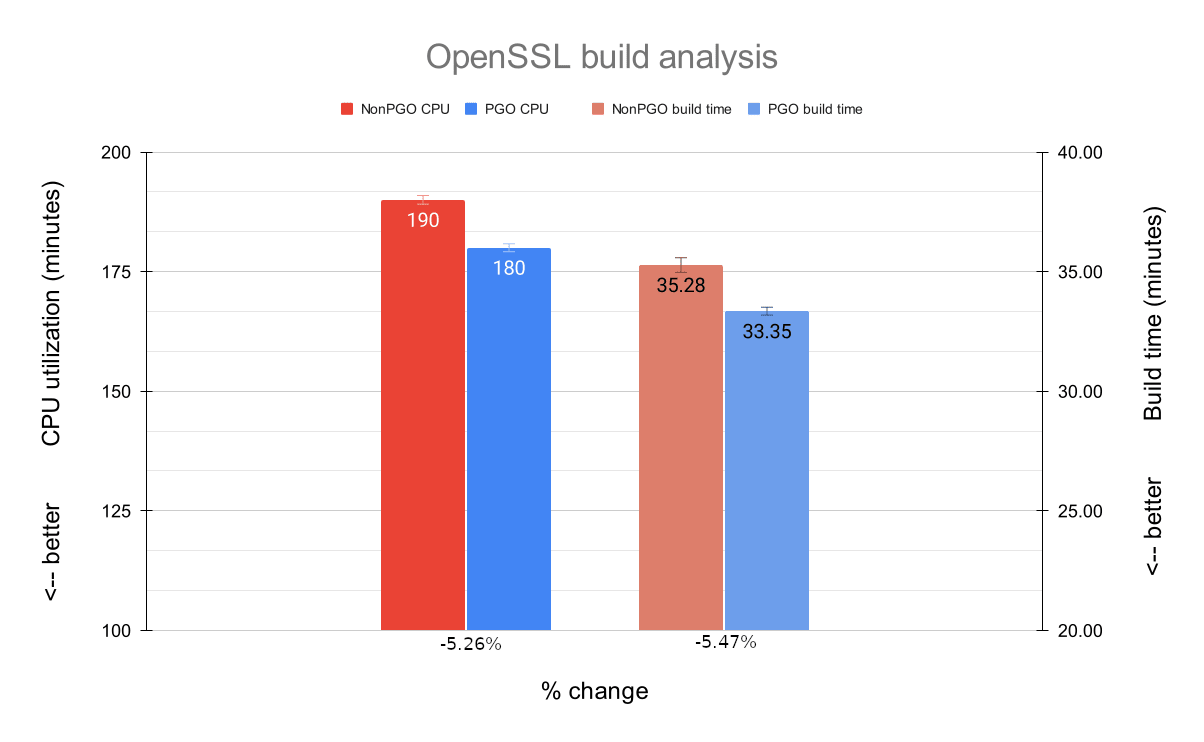
The average CPU utilization showed a noticeable improvement of 5.26% when building OpenSSL with a PGO-enabled QEMU. It is interesting to note that the percentage of CPU utilization was 3% higher at any given time while using PGO, but because the build time was reduced, the absolute CPU utilization in minutes was actually lower.
The average build time also decreased in a significant manner. On average, we see an improvement of 5.47% (or 1:56 minutes). This may not seem very high, but when you consider that Launchpad RISC-V builders are actually building dozens or even hundreds of packages a day, a ~5% gain in time is important.
But let’s not get ahead of ourselves. As you might remember, the optimized QEMU binary was built using profile data from an unoptimized QEMU building OpenSSL itself, so in a way it was expected for us to see performance gains in this scenario. Let’s check how the optimized QEMU fared when it was used to build different packages.
GDB
GDB is implemented in C++. Despite being somewhat similar to C, its compilation/linking process is much more CPU intensive and, as such, might ultimately require more from QEMU.
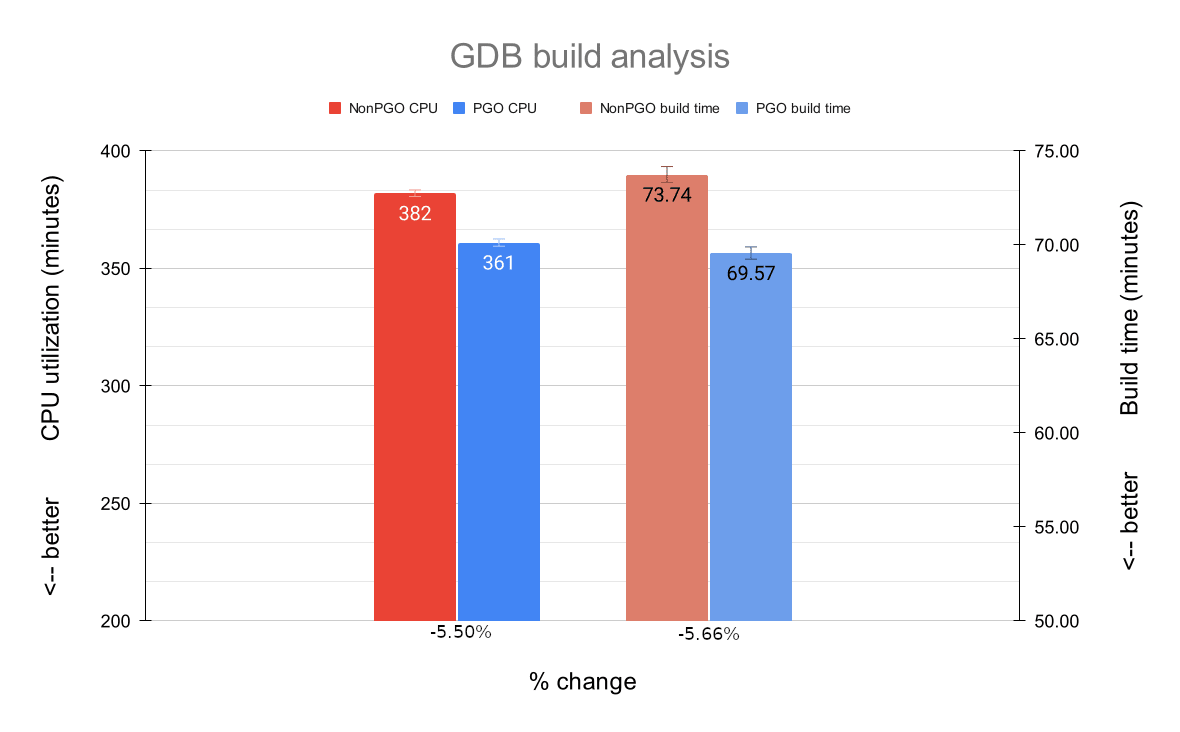
As with OpenSSL, the average CPU utilization improved significantly; we have an increased performance of 5.50% with a PGO-enabled QEMU.
The average build time improvement was also noticeable: 5.66% (or 4:10 minutes), which is a slightly higher percentage than the average for the OpenSSL builds.
Emacs
Emacs has a core written in C, but also has quite a number of Emacs Lisp packages that need to be processed during its build.
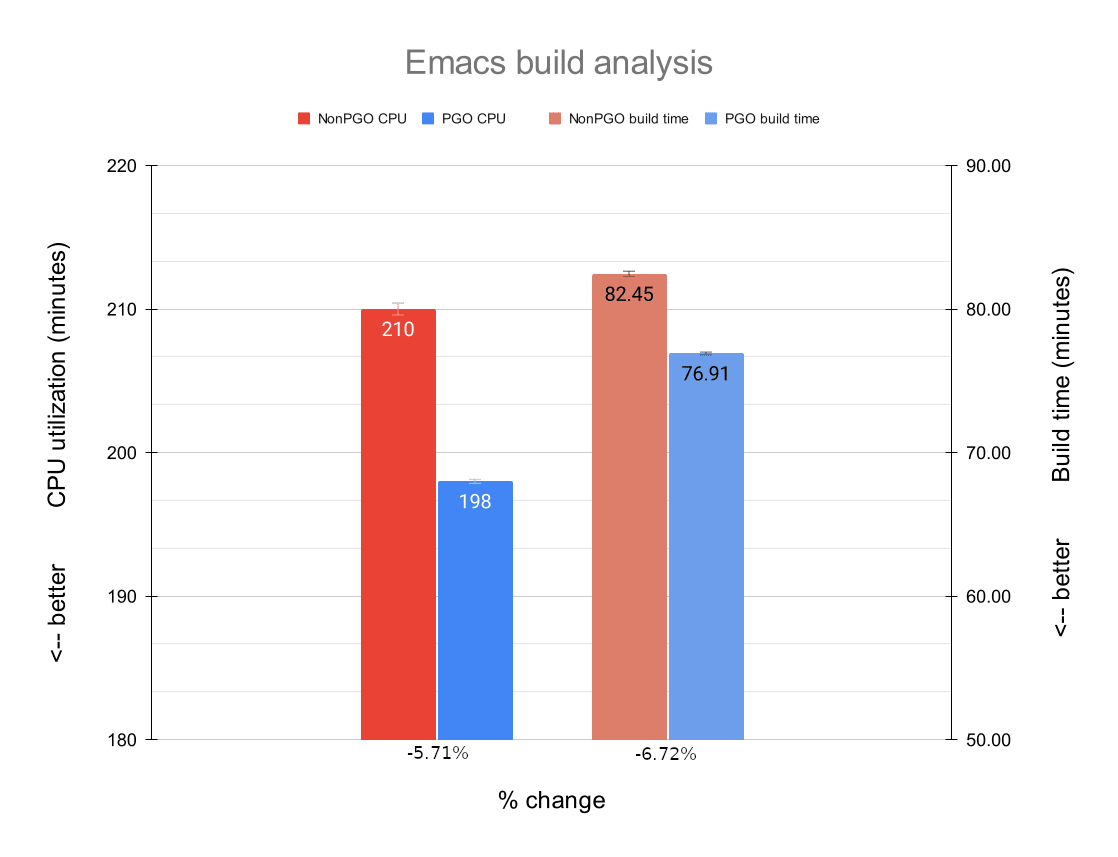
The average CPU utilization was lower during the Emacs builds; we see a performance increase of 5.71%. This is the highest performance gain of all packages.
The average build time differences here are also higher than the ones we have seen before. On average, we see a gain of 6.72% (or 5:33 minutes) in build time. Again, this is the highest improvement of all packages.
Python3.12
Python’s core is also written in C, but unsurprisingly there are also quite a number of Python files that need to be processed during its build.
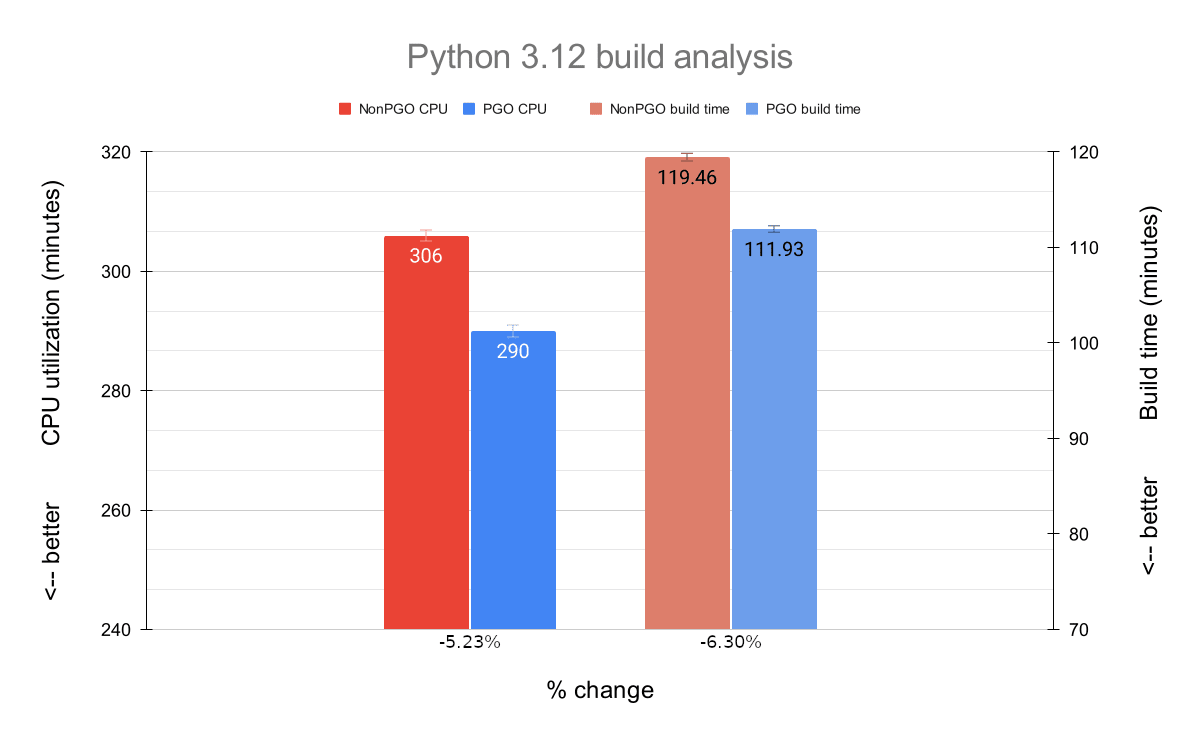
Continuing the trend, we see a good performance improvement when it comes to the average CPU utilization here: 5.23%.
The average build time was very noticeable again; on average, we have a speedup of 6.30% (or 7:32 minutes) when building Python3.12 with an optimized QEMU.
Conclusion
This was an interesting exercise. I believe the packages and scenarios chosen here can be considered representative workloads, even though they were not tested directly on Launchpad, and the tests did not reproduce certain peculiarities that Launchpad uses to build things.
Overall, we can conclude that using PGO did make a difference in the performance achieved by the modified QEMU package. We saw average CPU utilization and build time improvements of around 5-7%, which is significant especially when we consider that Launchpad performs several builds per day. A quick, back-of-the-envelope calculation shows that if we are able to save 5 minutes on a 1 hour build, and if we perform one build after another, over the course of a day we would have saved 2 hours, or two full builds. Conversely, when it comes to CPU utilization, improving the numbers might translate to energy savings or even the possibility of running more parallel QEMU processes.
But, it is also important to mention that PGO is not a silver bullet and may not be the right optimization approach for your problem (take a look at our documentation page about PGO for more details and counterexamples). In our case, although some effort was made to come up with different workloads to test the performance improvements, it could be said that these workloads are all minor variations of the same one: building an Ubuntu package inside an emulated environment. And that would not be completely wrong. On the other hand, this is exactly the scenario where PGO shines the most: optimizing highly specialized workloads. A rough rule of thumb is: the more variation in workloads you have, the less PGO might be able to help (and, in some cases, it might even introduce performance problems depending on how different the workloads are).
Another important scenario where PGO might be helpful is when a developer is trying to manually optimize a piece of software (using regular profiling tools, like perf top or perf record), but the program is so complex that it is hard to pinpoint what to actually improve. It is important to analyze the constraints of your particular scenario and decide whether using PGO makes sense.
Nonetheless, as we have seen above, Profile-Guided Optimization is a great technique when it comes to increasing the performance of a software, and we hope that this blog post and our documentation can paint a better picture of how you can implement it in your stack.

