Igor Ljubuncic
on 13 May 2021
How to troubleshoot application issues and crashes with snapd gdbserver
Sometimes, applications may not run well, or they could even crash. When such issues occur, it is useful to have a consistent, reproducible method of triggering the problem, so that developers can have a reliable way and sufficient data to troubleshoot the issues and produce a fix. In the software world, the GNU Debugger (gdb) is a powerful tool that allows developers to do just that.
With snaps, things are slightly more complicated. Snaps run as isolated, self-contained applications, with strong security confinement. They are managed and launched by the snapd service. This means that if you were to invoke gdb to troubleshoot snaps exhibiting startup or runtime issues, the actual application execution will be masked by the snapd processes that wrap it. To work around this phenomenon, and give developers the right tools for the job, the snap daemon also includes gdbserver, which allows users to inspect their applications in a manner that is very similar to the classic Linux system.
Invoke gdbserver
If you run a snap with the –gdb flag, gdb will launch and behave just as it would were it called against the same executable outside of the snap environment. Alternatively, you can run gdbserver, which also allows you to connect to gdb remotely, as well as offers the ability to run applications as a non-privileged (standard) user.
The syntax is as follows:
snap run --gdbserver “snap name”
This will start the snap, stop the execution at the entry point, instantiate gdb, and allow remote access to it via a random high port that will be printed on the command line.
snap run --gdbserver snapster

Welcome to "snap run --gdbserver".
You are right before your application is run.
Please open a different terminal and run:

gdb -ex="target remote :44626" -ex=continue -ex="signal SIGCONT"
(gdb) continue

or use your favorite gdb frontend and connect to :44626
Practical example
Let’s take a look at an application that crashes when invoked. If you’d like to follow along, please take a look at the following gist for details on the actual source code, the compilation flags, and the segfexample snap snapcraft.yaml contents.
snap run --gdbserver segfexample

Welcome to "snap run --gdbserver".
You are right before your application is run.
Please open a different terminal and run:
...
In a separate terminal window, running gdb -ex=”target remote :34621″ shows the following output:
gdb -ex="target remote :34621" -ex=continue -ex="signal SIGCONT"
GNU gdb (Ubuntu 8.1.1-0ubuntu1) 8.1.1
Copyright (C) 2018 Free Software Foundation, Inc.
License GPLv3+: GNU GPL version 3 or later <http://gnu.org/licenses/gpl.html>
This is free software: you are free to change and redistribute it.
There is NO WARRANTY, to the extent permitted by law.  Type "show copying"
and "show warranty" for details.
This GDB was configured as "x86_64-linux-gnu".
...
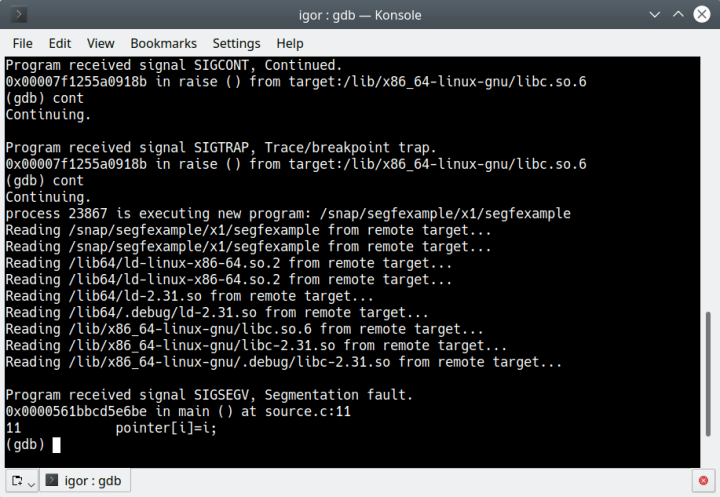
To resume execution, you need to type cont until you hit the issue – mind, like most issues that you can troubleshoot with gdb, these need to be time-independent, and reproducible:
Program received signal SIGCONT, Continued.
0x00007f1255a0918b in raise () from target:/lib/x86_64-linux-gnu/libc.so.6
(gdb)
…
Reading /lib/x86_64-linux-gnu/libc.so.6 from remote target…
Reading /lib/x86_64-linux-gnu/libc-2.31.so from remote target…
Reading /lib/x86_64-linux-gnu/.debug/libc-2.31.so from remote target…

Program received signal SIGSEGV, Segmentation fault.
0x0000561bbcd5e6be in main () at source.c:11
11            pointer[i]=i;

Once you know where the issue occurs, you can do troubleshooting like you normally would. You can set conditions, breakpoints, disassemble the code, and more. You will also need debug symbols for the specific versions of libraries that your applications uses to be able to decipher the functions where the bug occurs. If you use libraries available from your system archives, you can then install the matching debug packages. If you’re developing your own application, either compile it with symbols, or load the symbols into the debugger.

Summary
Troubleshooting problems is never easy. Sometimes, there can be complex issues in software, and it can take time and effort to resolve them. To that end, development ecosystems should be designed with as much foresight and flexibility as possible, to provide developers with a friendly and efficient setup that can help them fix code errors. With gdbserver, snapd offers snap publishers (and users) a convenient way of investigating and resolving repeatable bugs and crashes without compromising on the benefits of the snap security confinement.
If you have any suggestions on how to make application troubleshooting even more useful and resilient, please join our forum and share your thoughts.
Photo by christian buehner on Unsplash.


